

|
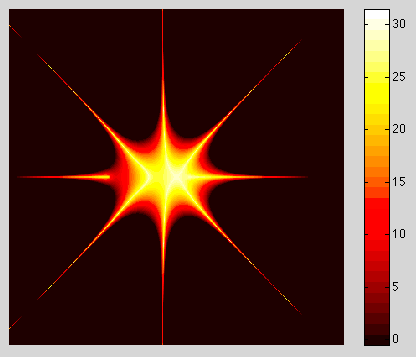
 The center of the 5 point star is (0,0i). The x and y limits are -2 to 2. |
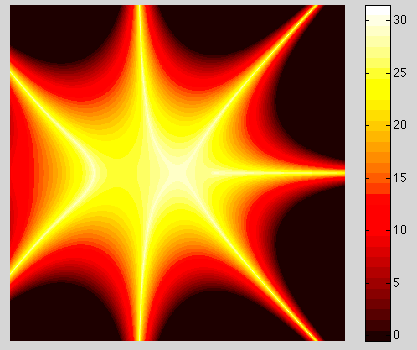
 The x and y limits are -6 to 6. The vertical asymmetry is still apparent. |
| MATLab code used h=400; w=400; ETMAX = 32; MAXDIST=2; Xaxis = linspace(-2,2,w); Yaxis = linspace(-2*h/w,2*h/w,h)*i; % matlab functions define colormap matrix (ETMAX rows x 3 columns) mp = colormap( hot(ETMAX) ); mp = cast(mp*255,'uint8'); % allocate the matrix ␣> use unsigned 8␣bit integers for images A = uint8( zeros(h,w,3) ); % think three pages of h by w pixels for m = 1:h for n=1:w Z=0; c = Xaxis(n) + Yaxis(m); Z1= Z^2 + c; Z2= (Z^2 + c)^2 + c; Z3= ((Z^2 + c)^2 + c)^2 + c; Mv= ((Z2-Z1).^2 - (Z3-Z2).^2).^0.5 ; esctime=30; Ma=1; while Mv >.01*Ma *Ma && esctime >1 Ma=Ma+1; esctime = esctime - 1; end A(m,n,:) = mp(esctime,:); end end imshow(A); colorbar; impixelinfo; |